Thaw: The data
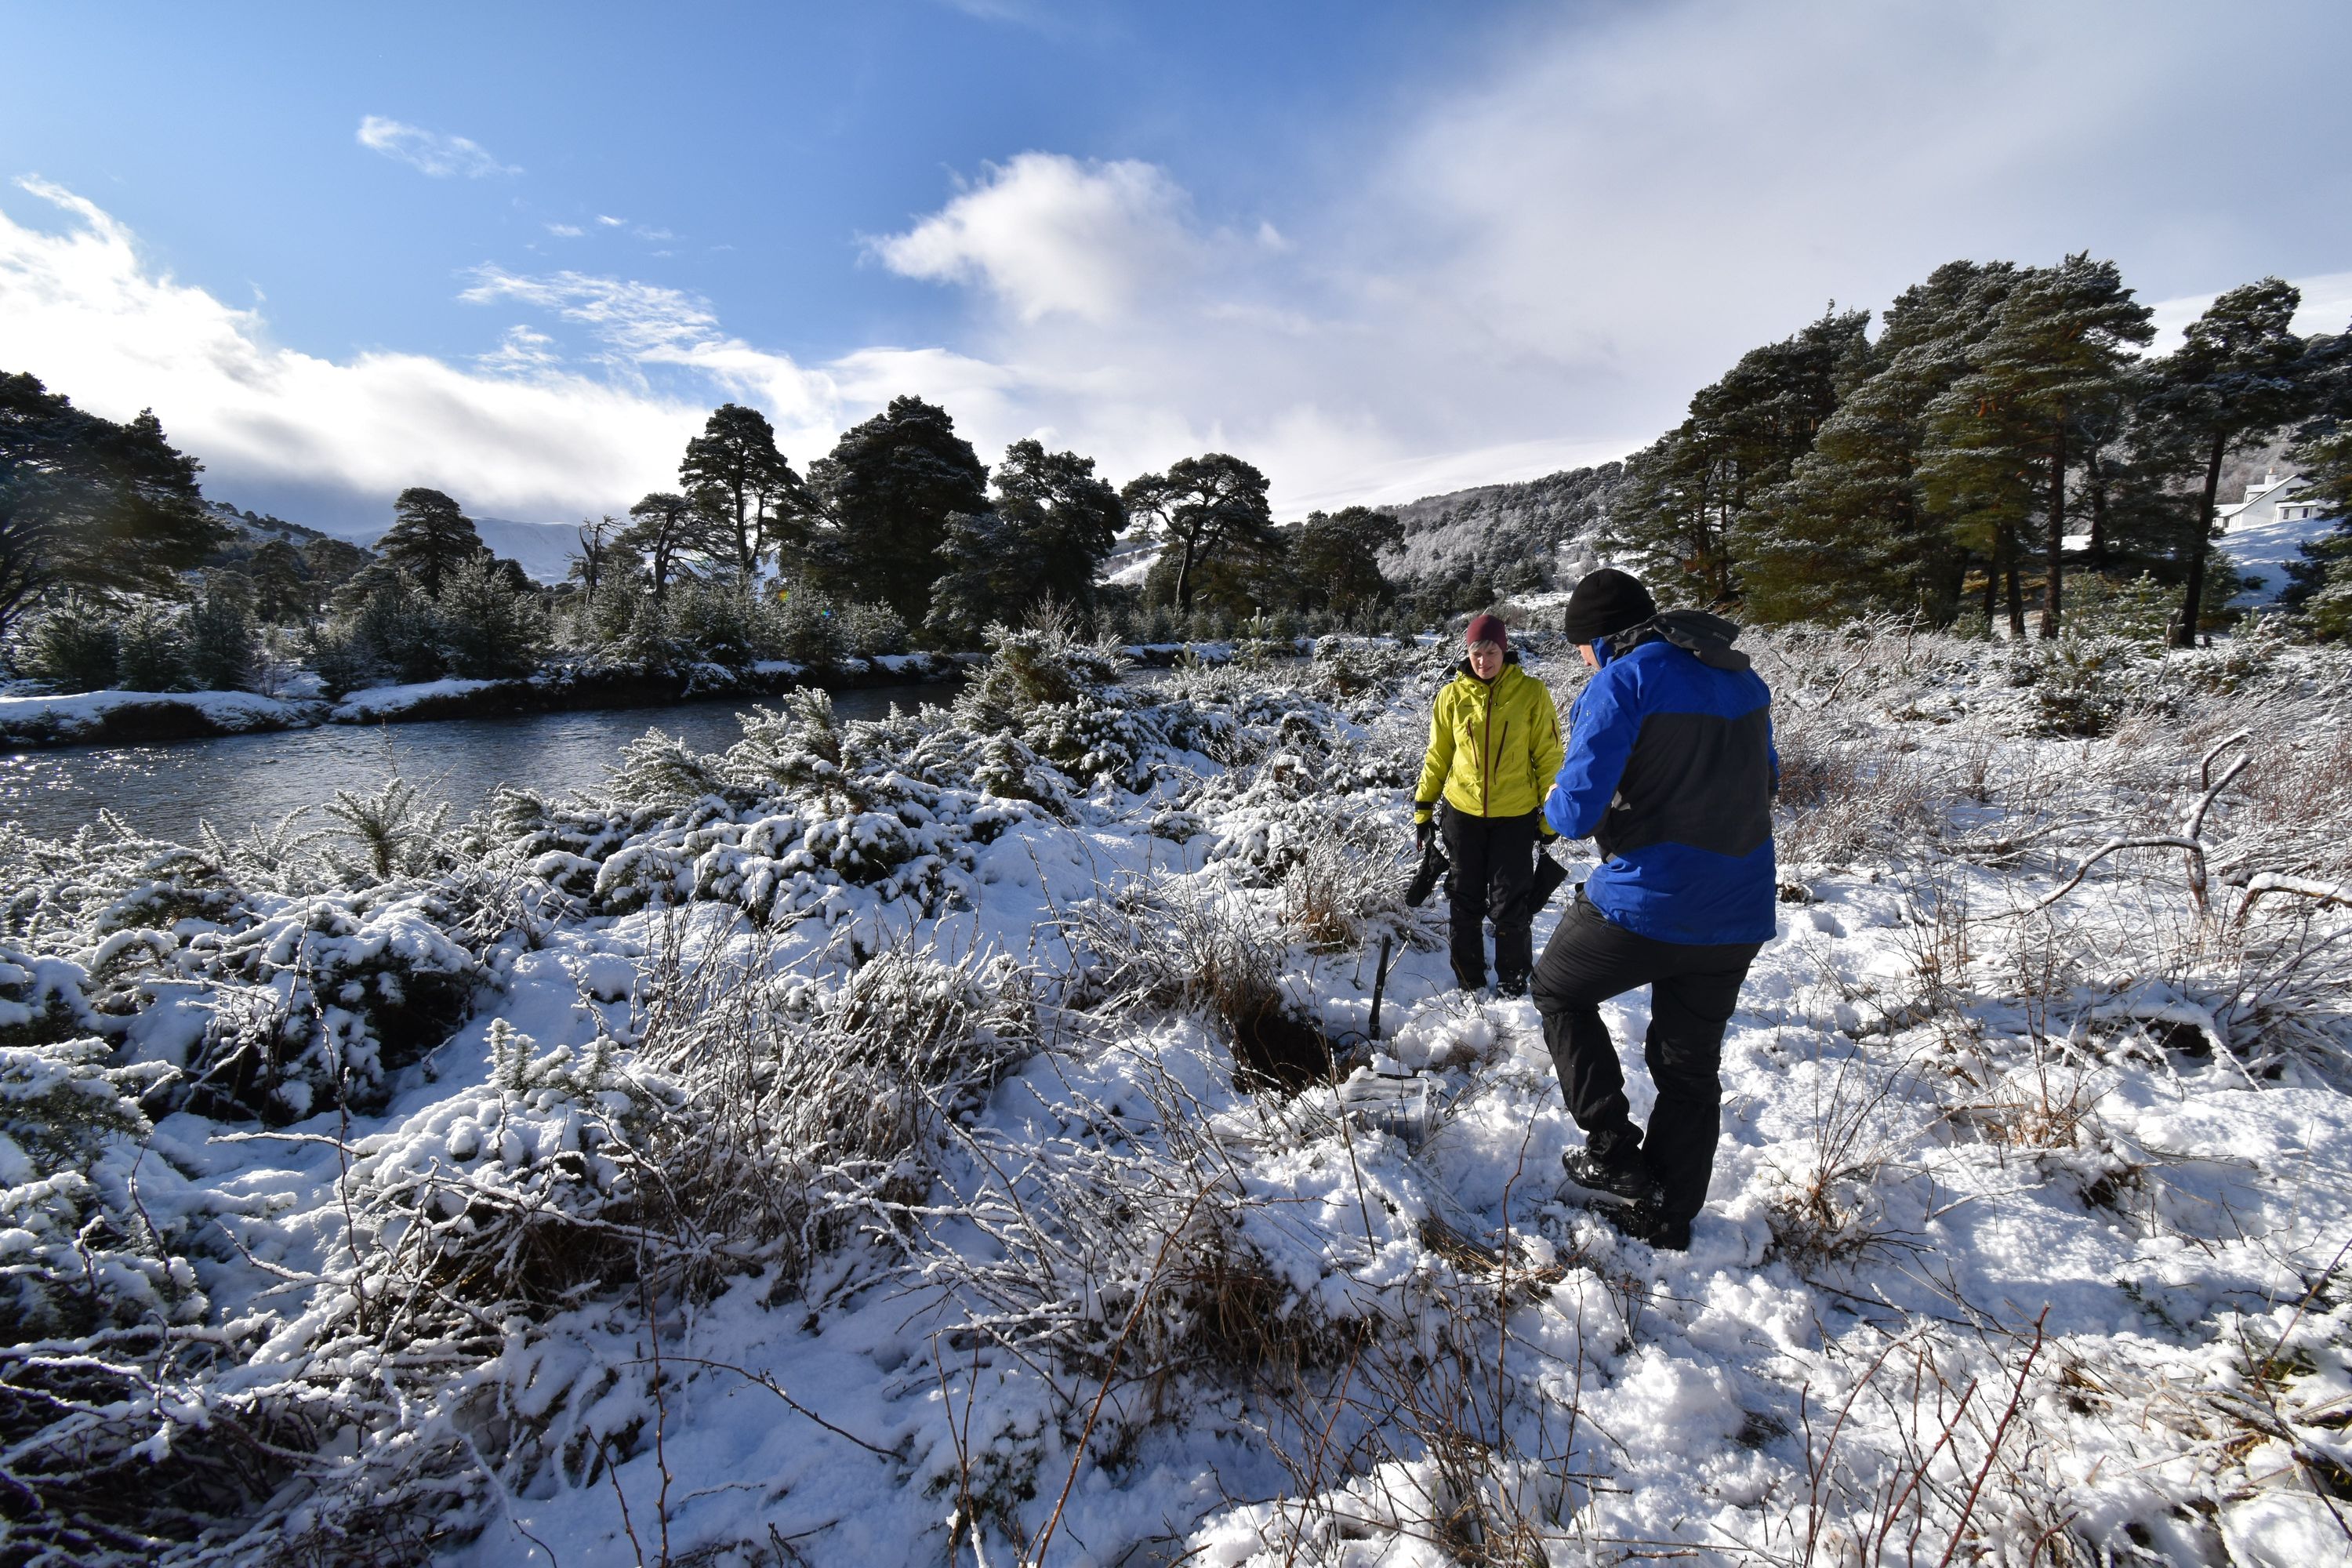
The data used in this project was mainly collected by scientists from the ‘Sounding Out the River’ team who’s help and generosity is gratefully acknowledged. I was fortunate to join during initial geophysical fieldwork at Glen Feshie, selecting instrument sites, testing equipment and recording the initial seismic dataset.
Scientific (and sonic) evidence for a snowmelt event in mid February 2021
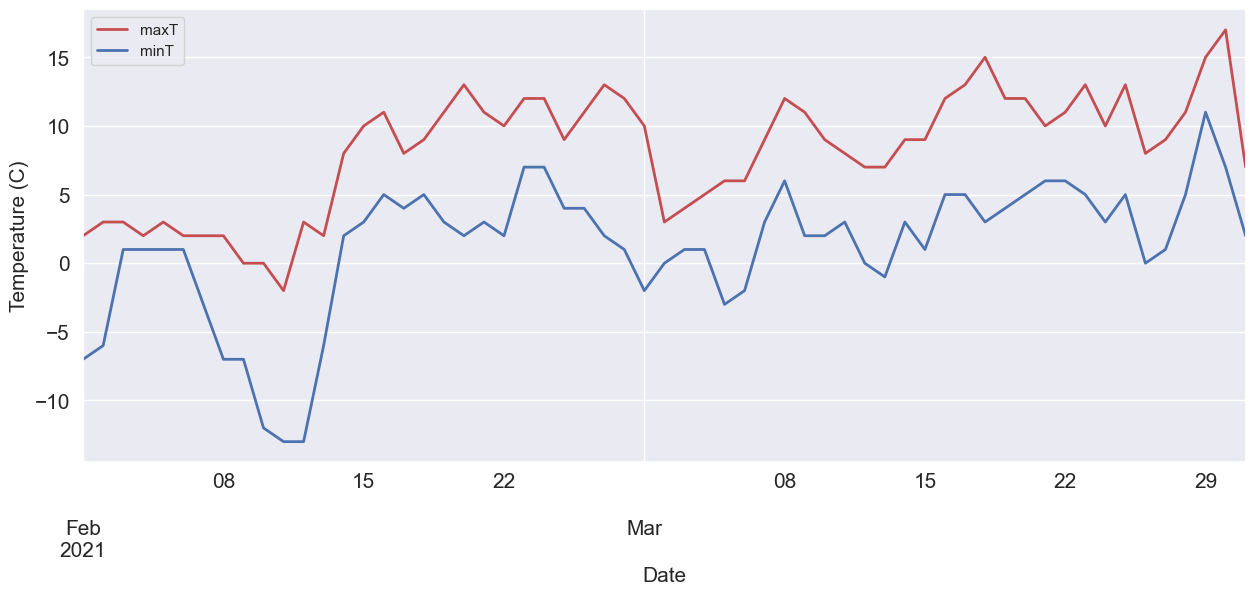
- 14th February 2021: Dramatic increase in Temperature
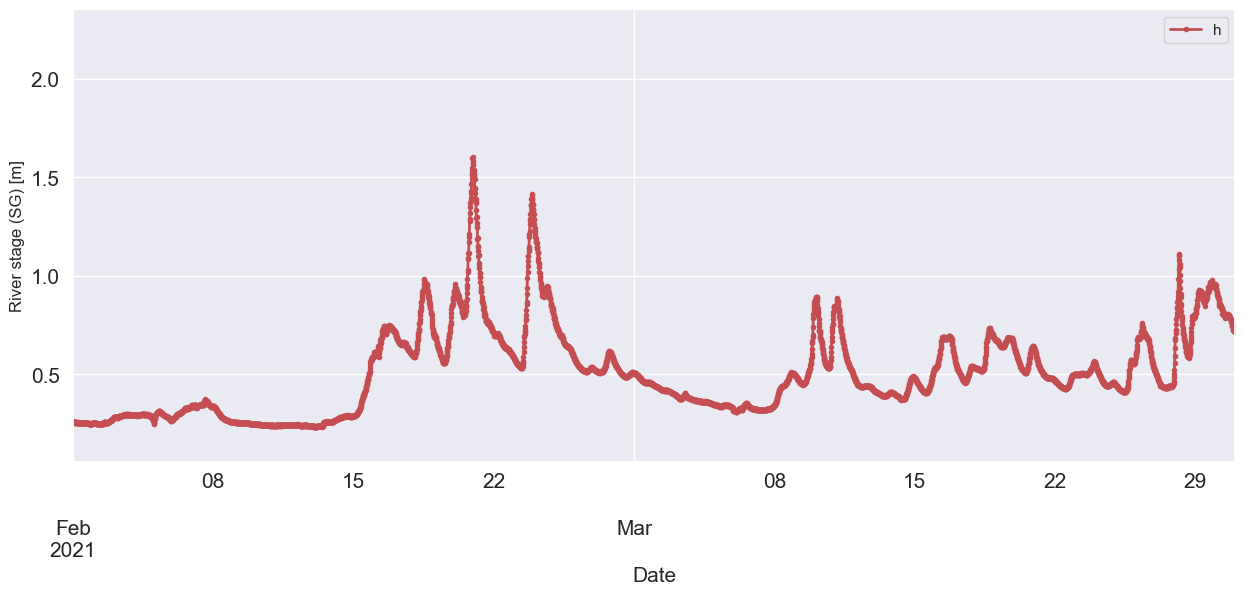
- 15th February 2021: Measured increase in river level
- 16th February 2021: Ice rafting event with ice float ‘clinks’ heard on seismic records
The main datasets used in sonifications are as follows:
- Stream Gauge data (15 minute time series dataset): Measured river height (SG (m)) and calculated river flow (Q in m3/s) are measured. This is the primary continuous dataset used to identify an interesting high river flow event and is the primary source data sonified in Thaw. After relatively low initial values in early February, river height (and flow) increases in mid February with subsequent sharp spikes and gradual decays.
- Temperature data (daily max and min time series dataset): Data are recorded downstream at feshiebridge (note this is a few degrees C warmer than Glen Feshie itself or the surrounding mountains). Importantly, early February is very cold staying below or close to freezing day and night for two weeks. On 14th February there is a significant warming of +10C which signifies a likely Thaw event. Temperature data are mapped to the frequency content of wind and also trigger a set of ‘cold’ and ‘warm’ sounds to give context in Thaw.
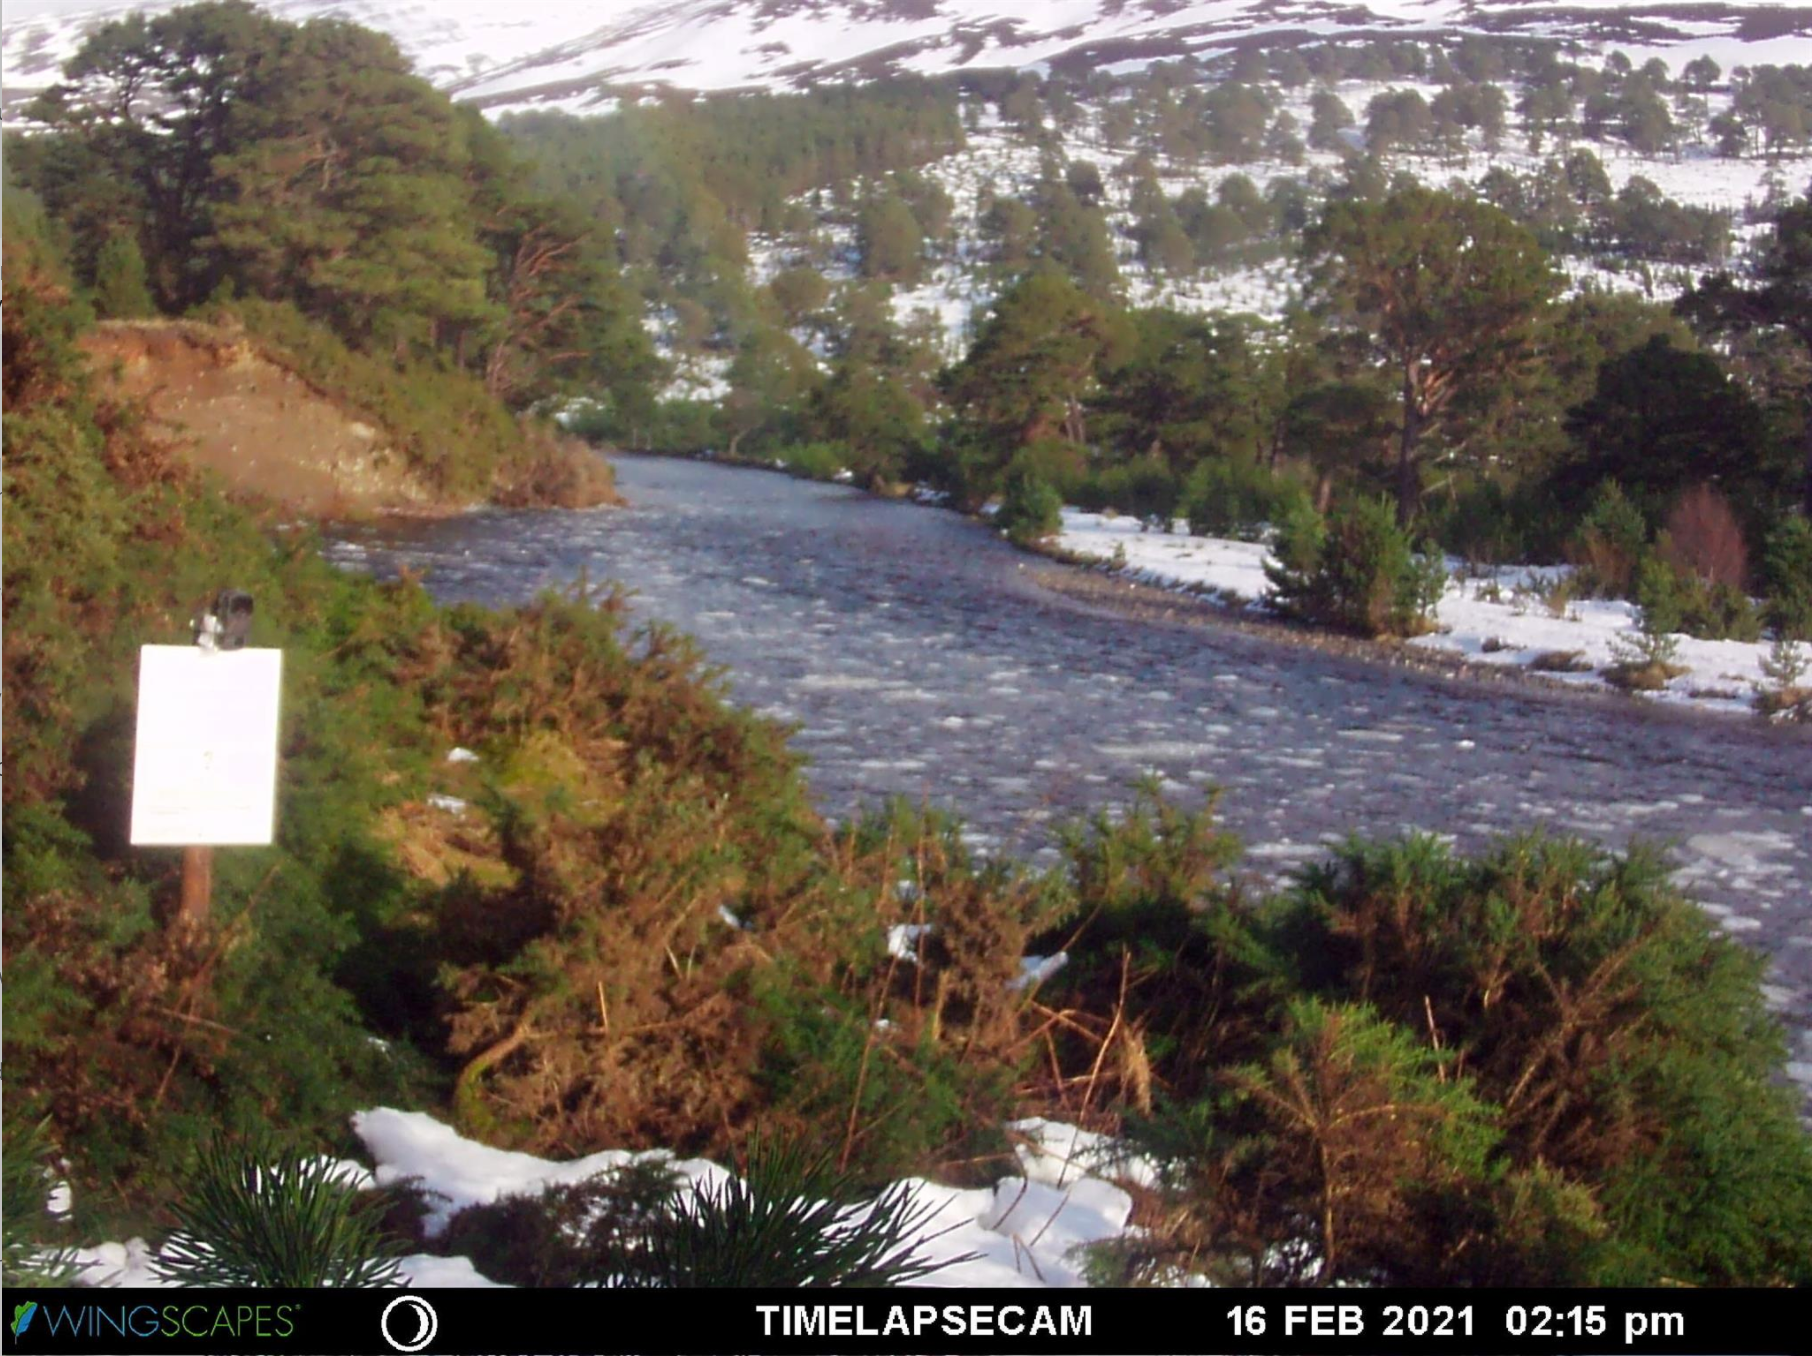
- Timelapse photographs (15 minute dataset - during daylight): These images show qualitatively the state of the flow and the surrounding weather conditions. In this case pervasive snow cover and the appearance of ice floats (white patches) migrating along the river. These sporadic ice floats events indicate recent melting are used to trigger ‘gin and tonic’ ice cube sounds in the Thaw. (image credit: M Naylor).
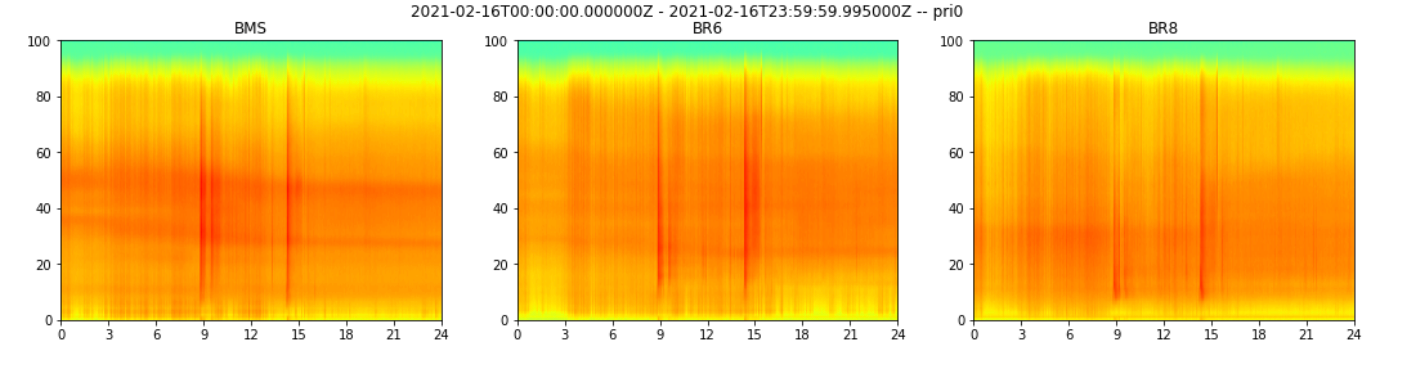
- Seismic data (200 samples/s time series): Several 3 component seismometers are now located along the river collecting data continuously. On 16th February, spectrograms show spikes (red) in the power spectra when ice floats pass or bunch up near the seismometer station. The timing of these events compares well with the timelapse photographs above. (image credit: B Matthews)
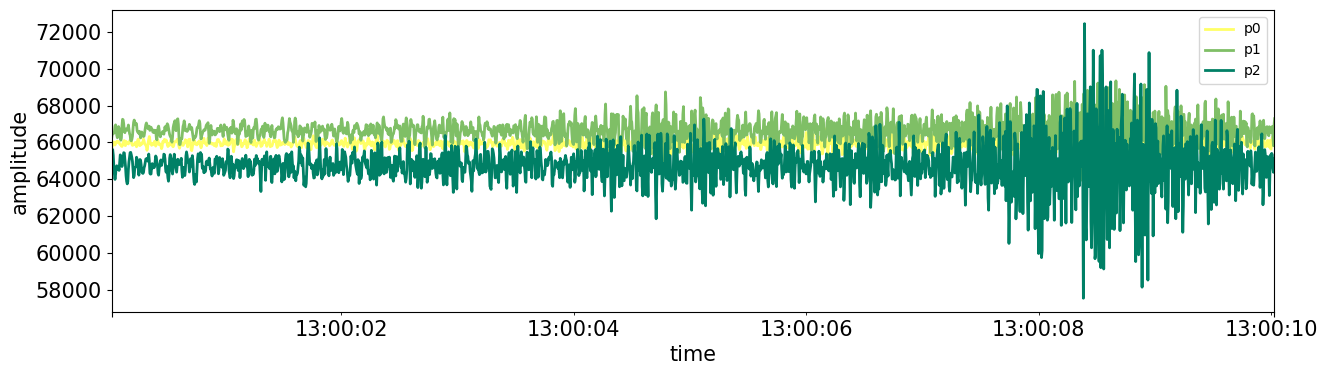
- Seismic waveform data: Enhanced shaking is likely evidence for bedload motion or turbulence during periods of high flow. Seismic data appear to show differences between periods of high and low flow but the source process is not yet distinguishable.